
NEW · DataLab public beta is now live
Create Scientific Figures. Analyze Data. All in One Workspace.
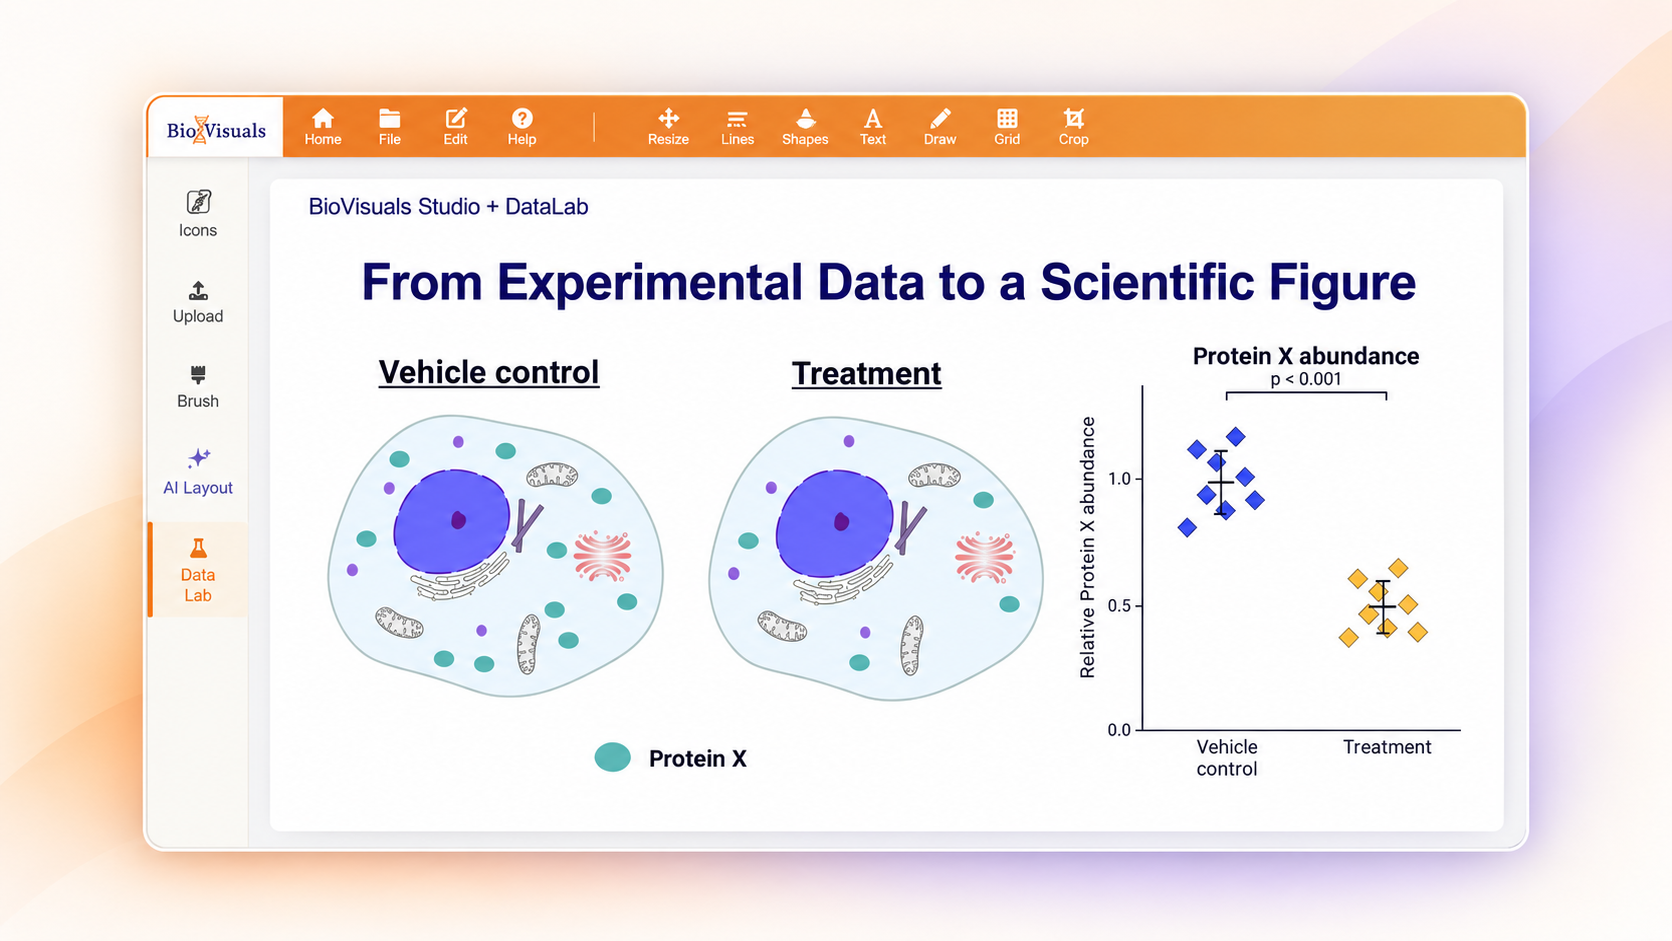
Design scientific figures with editable biological illustrations in BioVisuals Studio, analyze experimental data with DataLab, and bring everything together on one canvas.
- Researcher-controlled
- Editable charts
- Export up to 1200 DPI
BIOVISUALS DATALABBETA
Turn Experimental Data into Scientific Charts
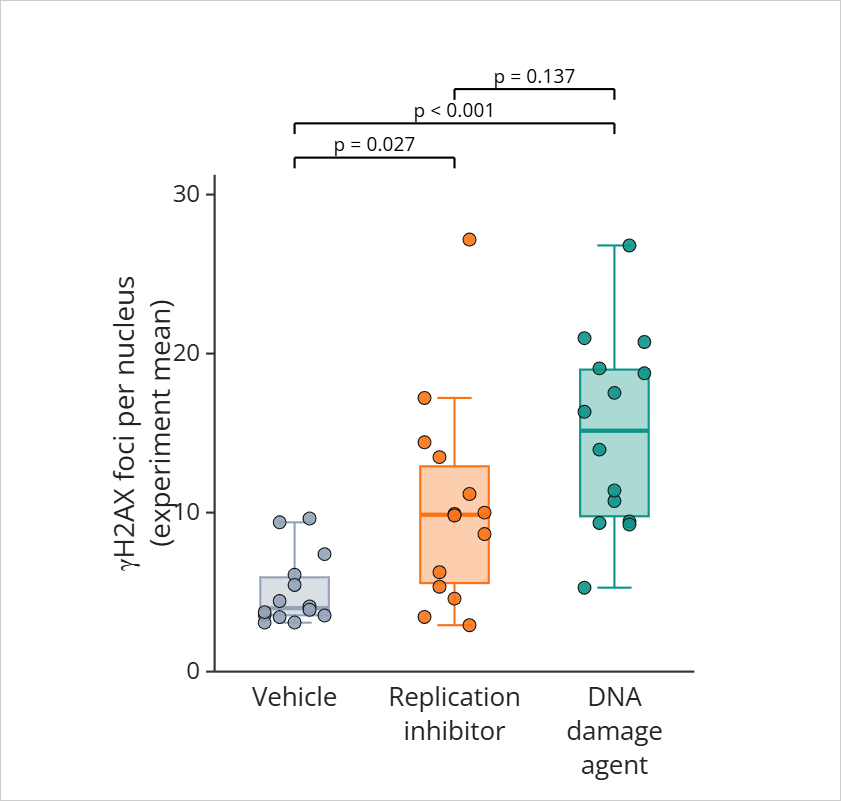
Explore statistical results, visualize biological variability, and create scientific charts directly within BioVisuals.
- Import Data
- Analyze
- Visualize
Featured Scientific Layouts
Explore professionally designed templates — perfect for figures, posters, and publications.

Cancer Metastasis

Hypertension

Tumor Microenvironment

Synapse
Why Scientists Choose BioVisuals
Simplify figure creation with real-time collaboration, shared team workspaces, and precision-ready scientific icons.
Real-Time Collaboration
Work together instantly — co-edit, comment, and brainstorm just like Google Docs, right in your canvas.
Shared Team Workspaces
Organize icons, templates, and figures in dedicated workspaces where your entire lab can collaborate.
Scientifically Accurate
Every icon and layout is curated by domain experts for biological accuracy — not generic clip art.
Affordable for Students & Researchers
High-quality scientific illustration tools shouldn’t be expensive. BioVisuals offers generous free access and the lowest academic pricing so every lab and student can create without barriers.
Extremely Easy to Use
A clean and intuitive interface designed for scientists - no design background required. Start creating clear figures in minutes.
Secure Cloud Storage & Auto-Save
Your illustrations are saved automatically and securely in the cloud, ensuring you never lose progress — even between devices.
BioVisuals in Published Research
Published figures created using BioVisuals
